In this post I will cover the spring boot microservice that I built. Microservice has a Rest endpoint for flights and also provides receiving flight objects (the same ones that are exposed via Rest WS) via JMS queue - in this case ActiveMQ.
If this was only a microservice that would be boring. So I decided to include Spring cloud ecosystem in to the mix.So in this project I added Eurika (discovery service) server, Spring boot actuator (to all projects), spring boot admin from Codecentric and finally from ordina.be microservice dashboard.
So let’s break up the demo app into components.
Spring boot microservice
Idea behind it was to make a small aplication that would expose a Rest ws and consume JMS messages. Back bone around this microservice is the Flight.java object:
{
    "id": 1,
    "carrier": "LH",
    "origin": "FRA",
    "destination": "MUC",
    "flightNumber": "100",
    "departureDate": "2017-01-15"
}
In order to have some objects to query, there is a FlightDAO.java which populates some dummy flights and allows finding flight by various queries. This DAO is used by FlightController.java which is a Rest controller for Flight.java.
Consuming JMS messages for flights is done by Apache Camel and for it there is the JmsRouter.java. Which is a standard Apache Camel router that forwards JMS messages to FlightProcessor.java.
For logging I have added AOP MethodLoggerAop.java which logs incoming requests to methods and outcome result plus time in milliseconds how long it took for the result to be generated. Since I don’t have any database or complex processing times outputed will be small.
Spring boot actuator and Eurika client have been added for the following steps.
Code for the microservice can be found here: GitHub Repository
Application properties file looks like so:
spring.application.name=demo-app1

spring.activemq.broker-url=failover:(tcp://localhost:61616?connectionTimeout=3000&soTimeout=3000&trace=false&keepAlive=true)
spring.activemq.user=admin
spring.activemq.password=admin
spring.activemq.pool.enabled=true
spring.activemq.packages.trust-all=true

#Apache Camel properties
camel.springboot.jmxEnabled=true

#Camel route properties
jms.router.enabled=true
jms.router.queue.name=INCOMING_MSG

#Logging
logging.level.=INFO

# AOP METHOD LOGGER
method.logger.enabled=true
JMS broker is ActiveMQ running on default port 61616.
Eureka server
Eureka allows service discovery. It’s part of the Spring cloud and was first developed by Netflix for their internal use, but was adopted by Spring withing the Spring cloud project.
Once the Eurika server is up, and microservice is running we get the following by entering http://localhost:8716
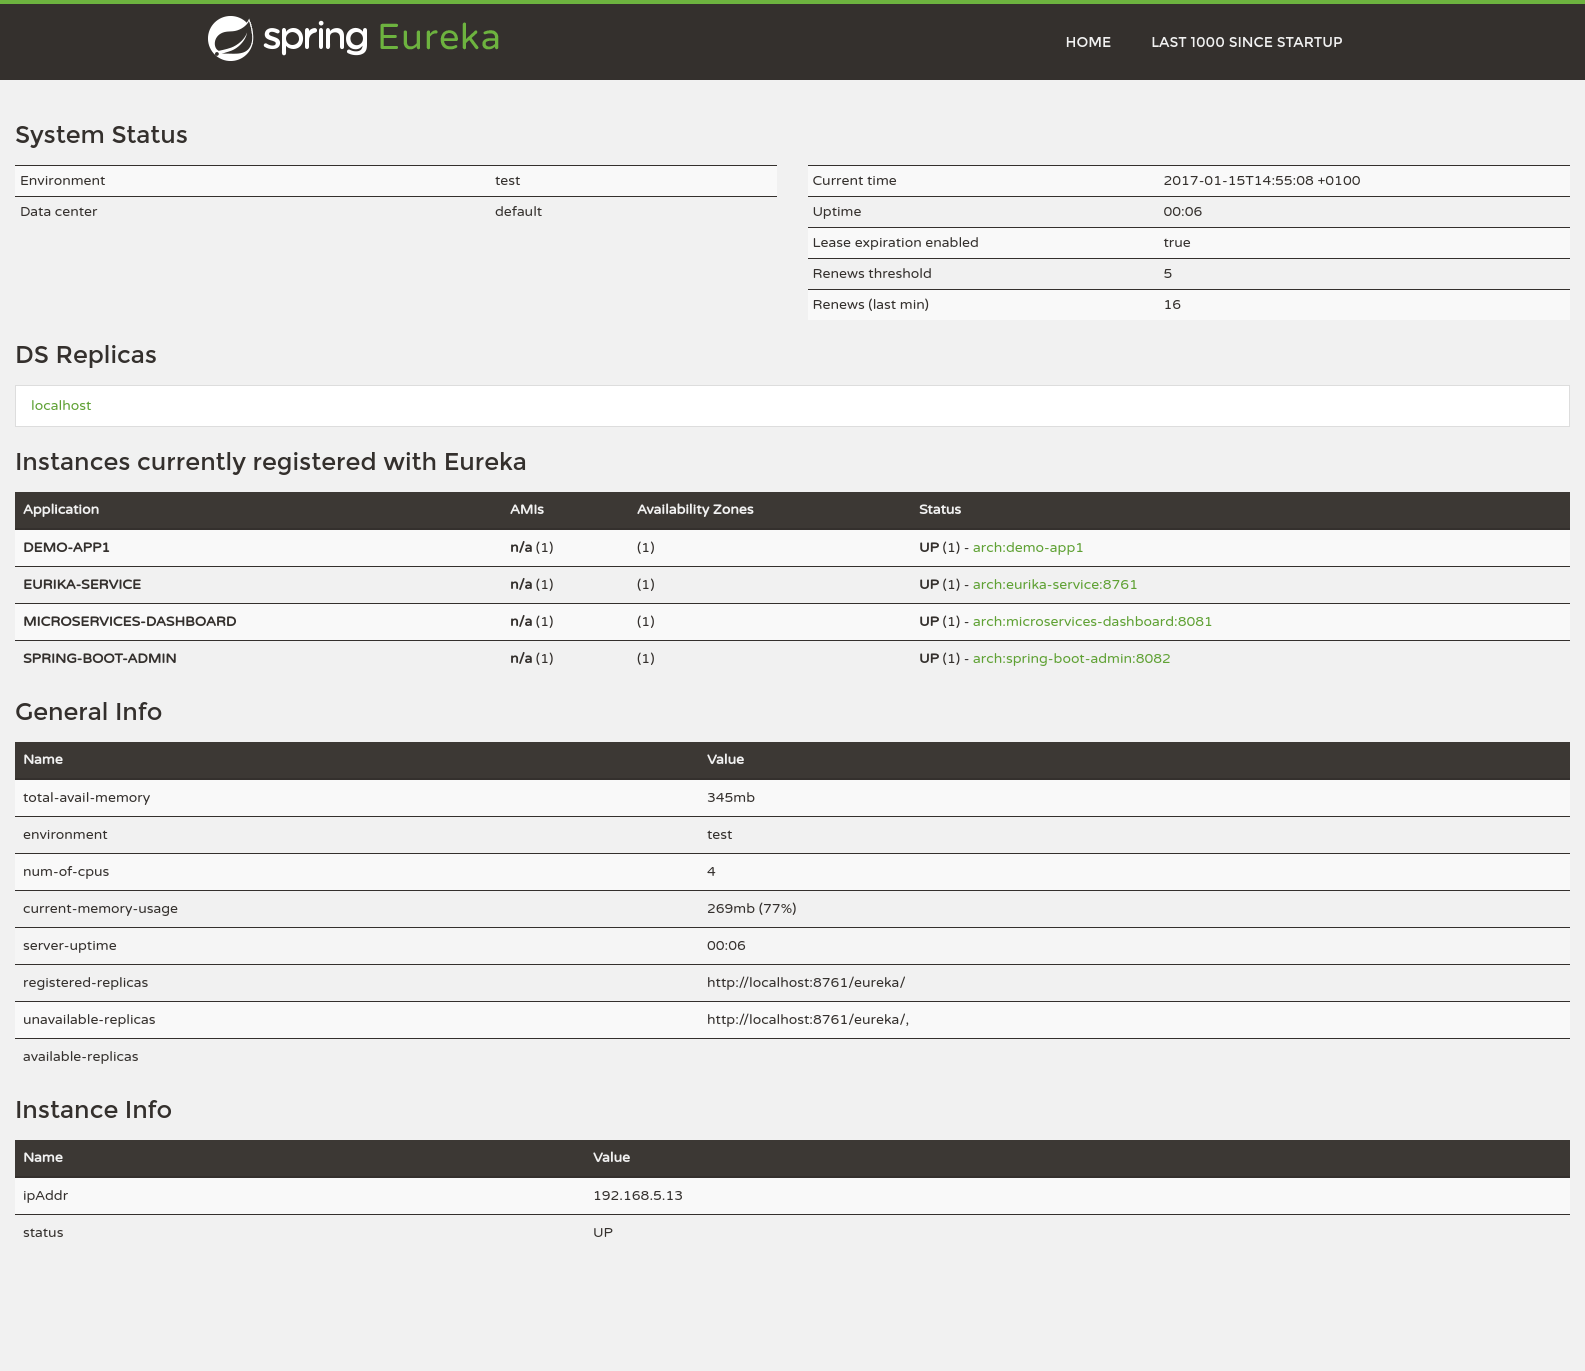
Port 8716 is not the standard port on which it runs, it was defined by me in application.properties file:
spring.application.name=eurika-service
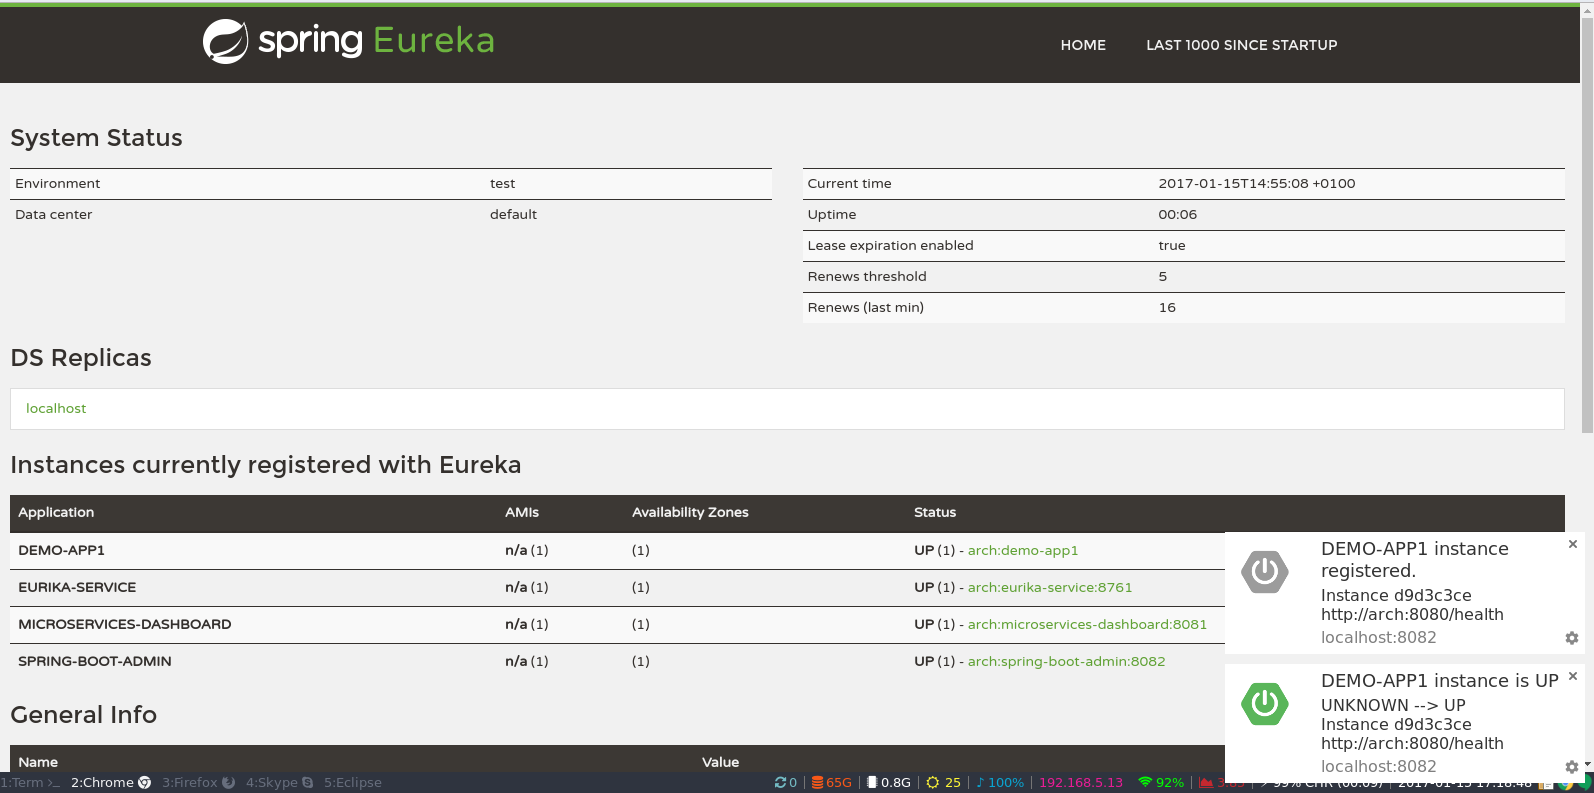
server.port=8761Once Eurika is up and running in your browser it will push browser notification each time it discovers a new component or if one service goes down. This is how it a browser notification looks like when its discovered by Eurika:
Code for the Eureka server can be found here: GitHub Repository
When creating the project the important thing is to include web, Eureka server and actuator dependencies.
Spring boot admin
On to the next component which is the spring boot admin which is developed by Codecentric. It uses Eurika server and Spring boot actuator (which has to be available in2 each project) for it to be available in admin pages. Application properties file has nothing special defined. Only application name and port on which it will run:
spring.application.name=spring-boot-admin
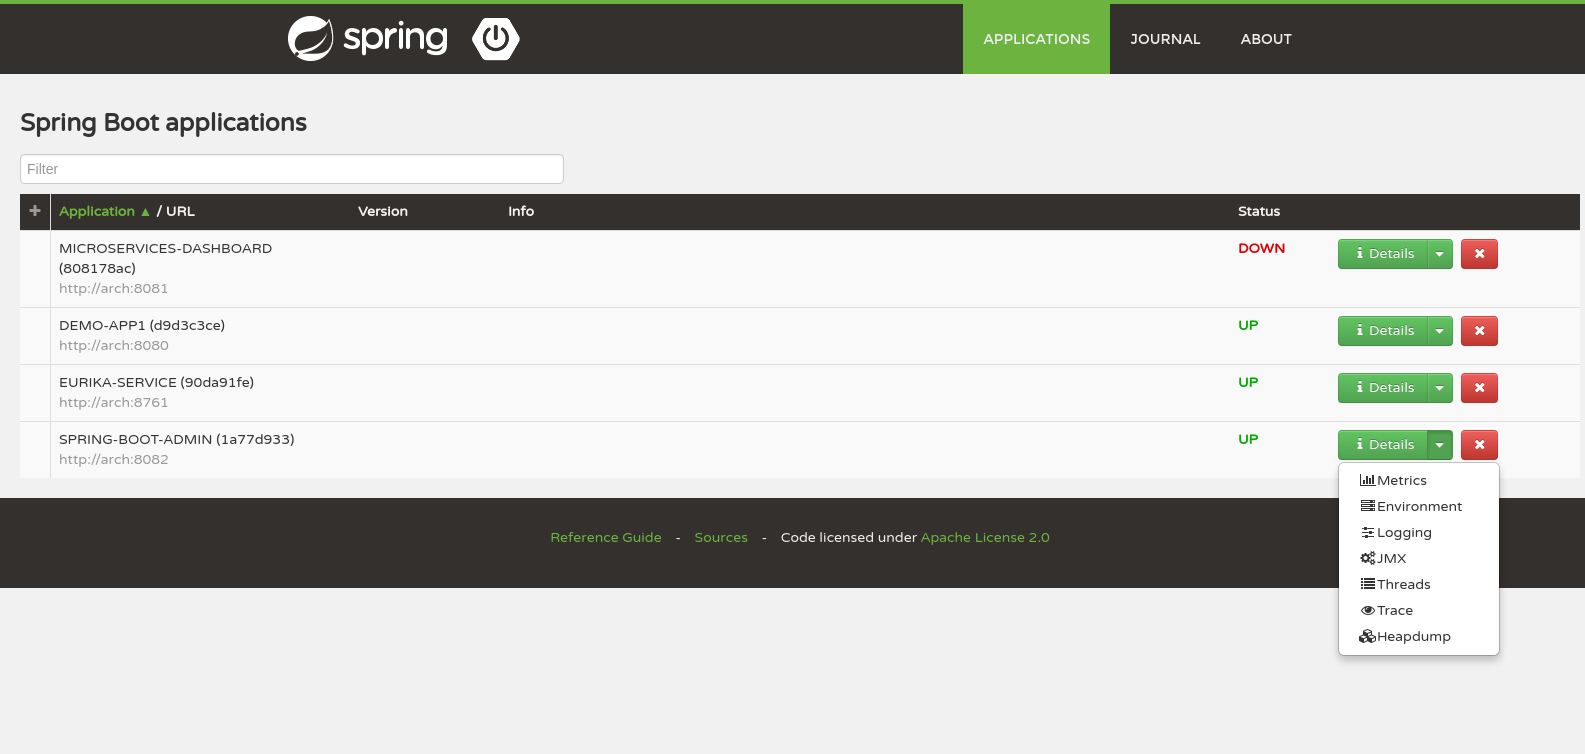
server.port=8082Once everything is up and running we get the following pages on http://localhost:8082
Code for the Spring boot admin can be found here: GitHub Repository
When creating the project the important thing is to include web, Eureka discovery and actuator dependencies from Spring plus Codecentric’s:
<dependency>
	<groupId>de.codecentric</groupId>
	<artifactId>spring-boot-admin-server</artifactId>
	<version>${admin.server.version}</version>
</dependency>

<dependency>
	<groupId>de.codecentric</groupId>
	<artifactId>spring-boot-admin-server-ui</artifactId>
	<version>${admin.server.version}</version>
</dependency>
Version of admin server which I used is 1.4.4.
Great thing about the admin server is that it allows web gui for actuator endpoints. So it’s easy to get the environment variables of each service. Check on which port each component is running. Refresh context or ever get the Heapdump.
Microservice dashboard
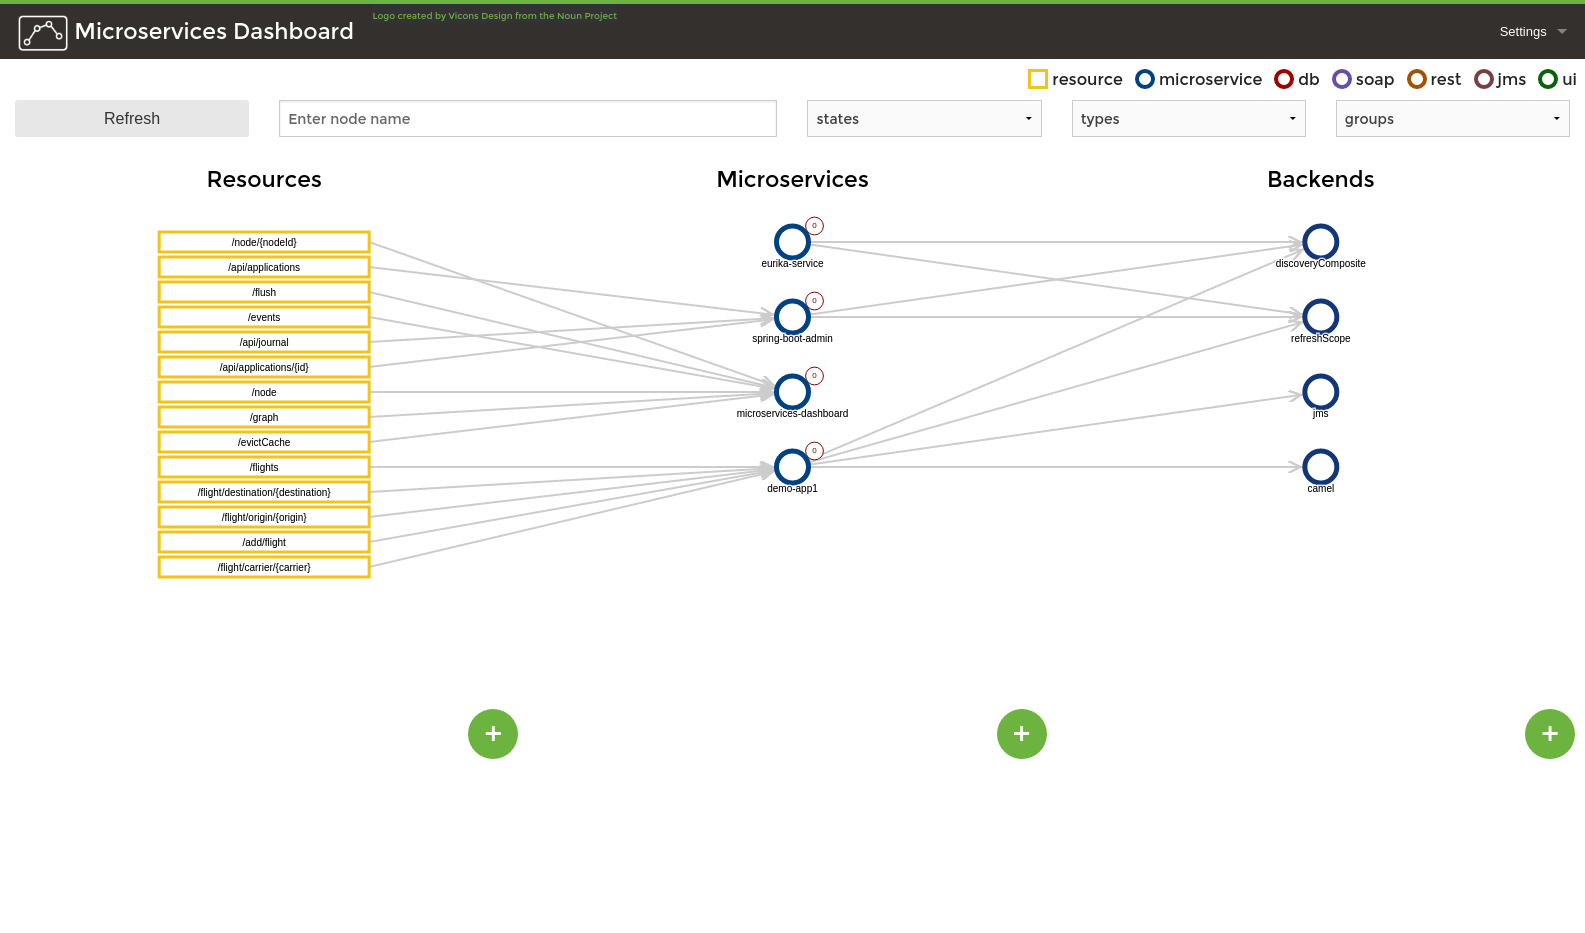
Microservice dashboard allows for the entire architecture to be visualized easily. When somebody would ask me to describe to them the architecture of this app I would show them the graph which is generated by microservice dashboard.
It lists all Rest endpoints which are exposed, which components connect and communicate with each other. All of Rest endpoints are listed in first column, in the second are all of the the microservices while in the last column all backends are listed. Dasboard even listed Apache Camel and JMS components. What else can you ask?!?
Now imagine you have a lot more components to visualize, then you have a filters where you can exclude component that are no interest to you. And this is how it looks:
Code for the microservices dashboard can be found here: GitHub Repository